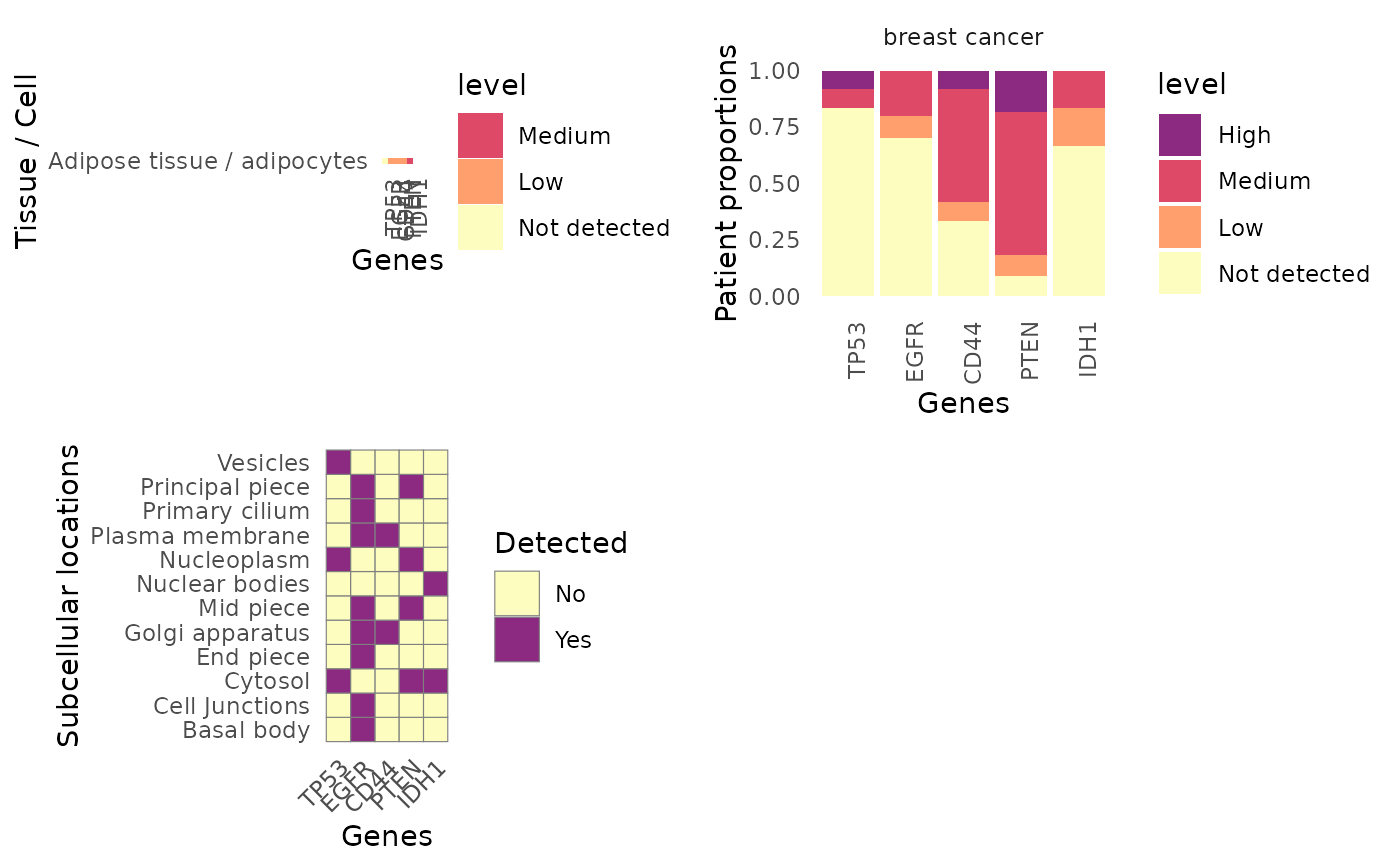
This function is an universal visualization function that allow calling other
hpaVis functions via a single function call. By default, this function will
use the dataset bundled with HPAanalyze, and provide a grid of all available
plots. The types of plots in the output can be specified via the
visType argument. If only one plot type is specified, this function
will return the exact same output as the specific hpaVis function used to
create the plot.
Arguments
- data
Input the list object generated by
hpa_download()orhpa_subset(). By default this function use the example dataset bundled with HPAanalyze.- targetGene
Vector of strings of HGNC gene symbols. By default it is set to
c('TP53', 'EGFR', 'CD44', 'PTEN', 'IDH1'). You can also mix HGNC gene symbols and ensemnl ids (start with ENSG) and they will be converted to HGNC gene symbols.- targetTissue
Vector of strings of normal tissue names. By default it is set to the first available.
- targetCellType
Vector of strings of normal cell types. By default inludes all available cell types in the target tissues.
- targetCancer
Vector of strings of normal tissues. By default it is set to the first available.
- visType
Vector of strings indicating which plots will be generated. Currently available values are
"all","Tissue","Patho","Cancer","Subcell".- color
Vector of 4 colors used to depict different expression levels.
- customTheme
Logical argument. If
TRUE, the function will return a barebone ggplot2 plot to be customized further.- ...
Additional arguments to be passed downstream to other hpaVis functions being called behind the scene. These arguments includes
targetTissue,targetCellType,targetCancer. See documentation for individual hpaVis functions for more information.
Value
If multiple visType is chosen, this function will return multiple graphs in one panel. If only one visType is chosen, this function will return a ggplot2 plot object, which can be further modified if desirable. See help file for each of the hpaVis function for more information about individual graphs.
See also
Other visualization functions:
hpaVisPatho(),
hpaVisSubcell(),
hpaVisTissue()
Examples
  hpaVis()
#> No data provided. Use version 25.1.
#> targetGene variable not specified, default to TP53, RB1, MYC, KRAS and EGFR.
#> targetTissue variable not specified, default to first available.
#> targetCellType variable not specified, visualize all.
#> * WARNING: targetCellType variable not specified, visualize all.
#> >> Use hpaListParam() to list possible values for target variables.
#> targetCancer variable not specified, default to first available
#> Use hpaListParam() to list possible values for target variables.