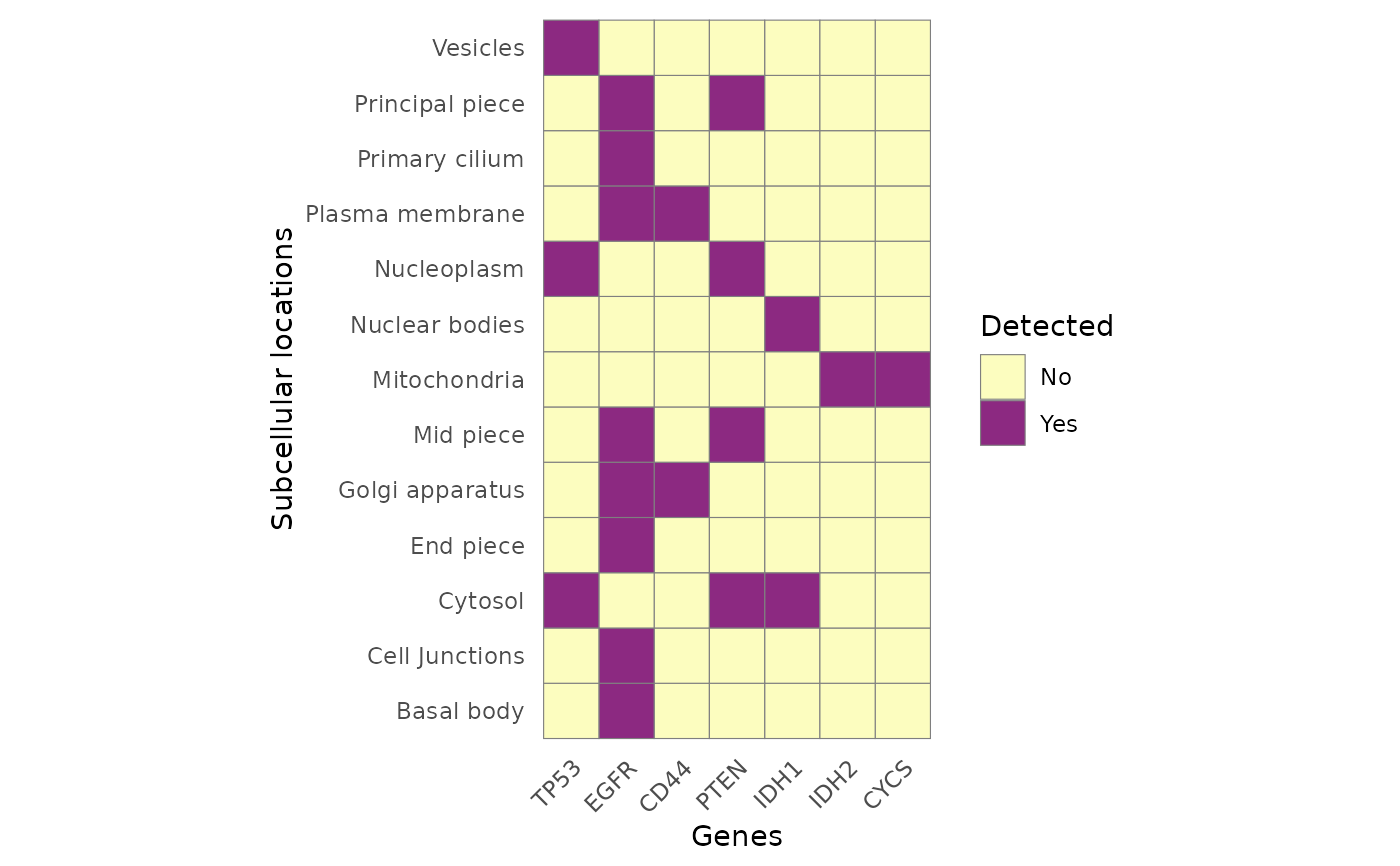
Visualize the the confirmed subcellular locations of genes of interest.
Arguments
- data
Input the list object generated by
hpa_download()orhpa_subset(). Require thesubcellular_locationdataset. Use HPA histology data (built-in) by default.- targetGene
Vector of strings of HGNC gene symbols. By default it is set to
c('TP53', 'EGFR', 'CD44', 'PTEN'). You can also mix HGNC gene symbols and ensemnl ids (start with ENSG) and they will be converted to HGNC gene symbols.- reliability
Vector of string indicate which reliability scores you want to plot. The default is everything
c("enhanced", "supported", "approved", "uncertain").- color
Vector of 2 colors used to depict if the protein expresses in a location or not.
- customTheme
Logical argument. If
TRUE, the function will return a barebone ggplot2 plot to be customized further.
Value
This function will return a ggplot2 plot object, which can be further modified if desirable. The subcellular location data is visualized as a tile graph, in which the x axis includes the inquired proteins and the y axis contain the subcellular locations.
See also
Other visualization functions:
hpaVis(),
hpaVisPatho(),
hpaVisTissue()